Data Project | Music Animation
This animation was one of the outcomes from my data project in my second year of my illustration course.
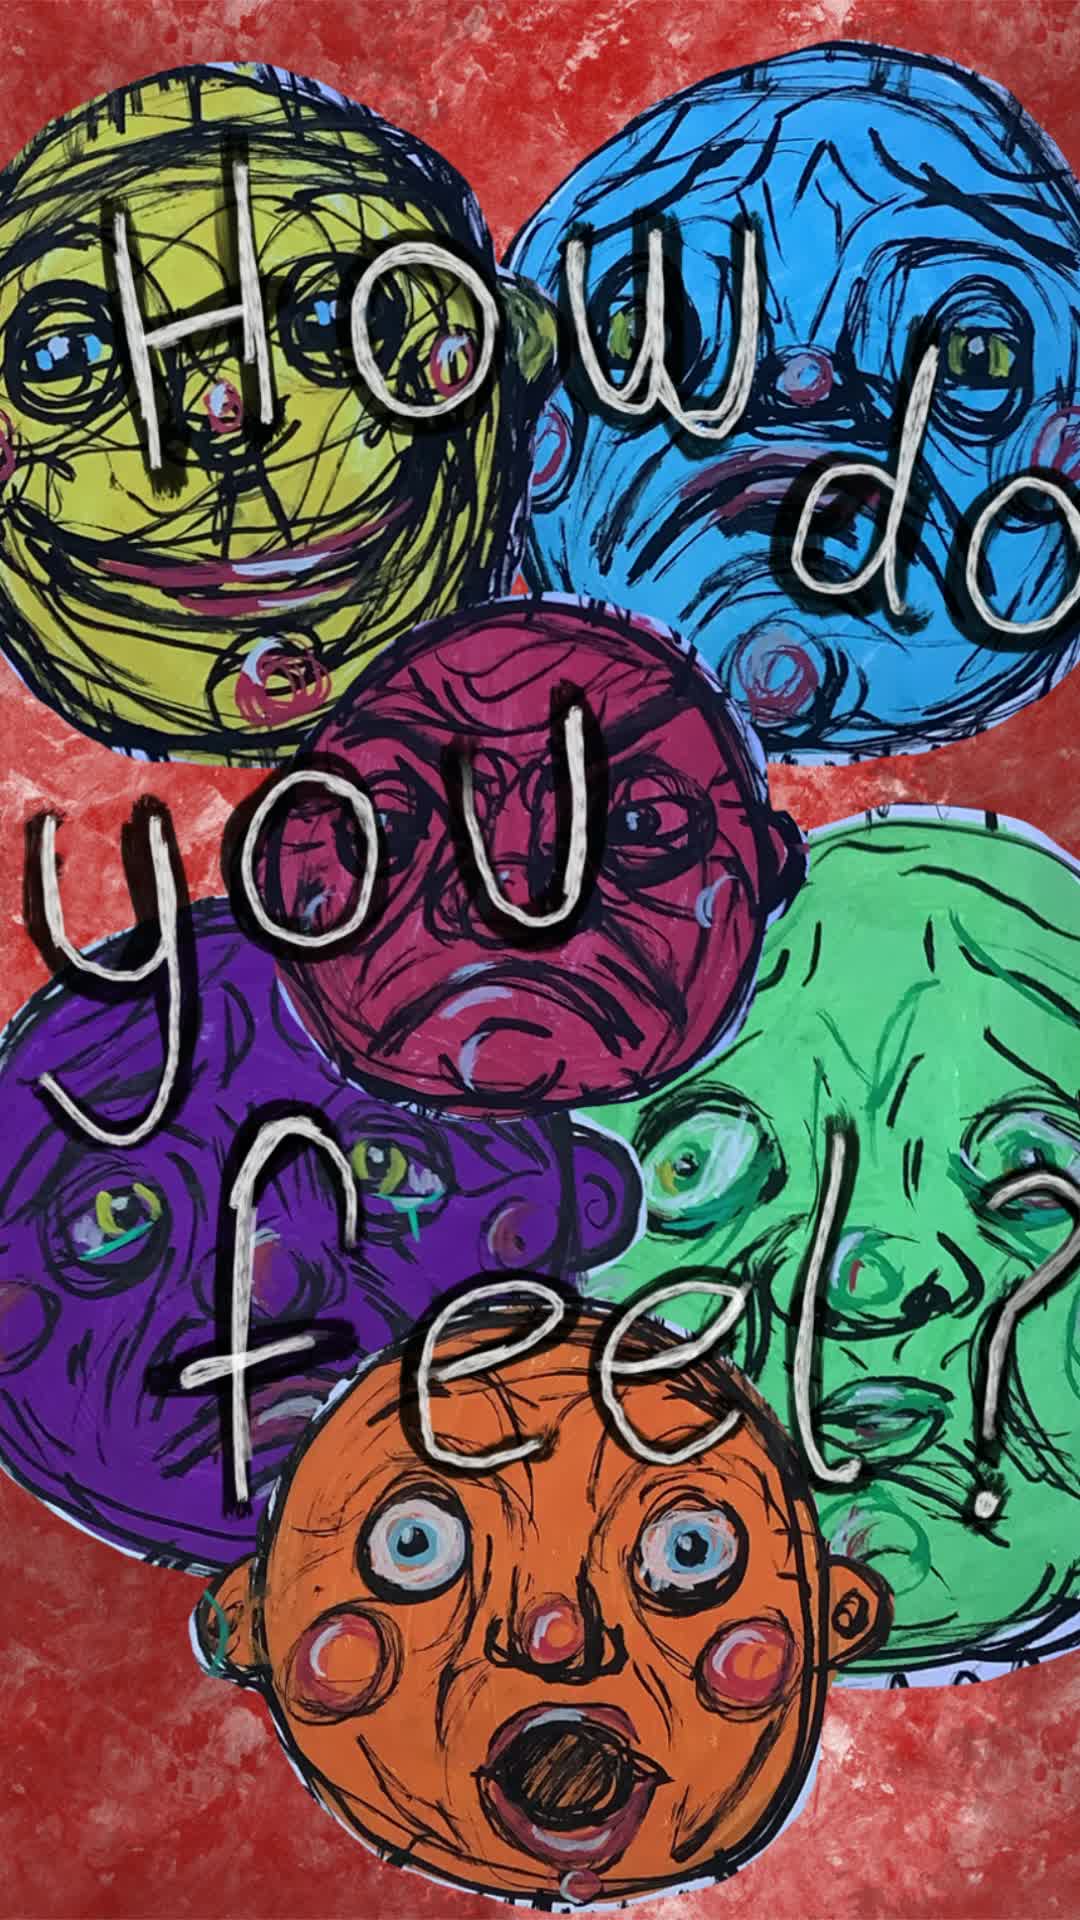
The data that is being shown in this animation is how often I practiced playing different instruments throughout a week.
Each colour represents the different instruments:
Pink = electric guitar
Yellow = acoustic guitar
Green = bass guitar
Blue = piano
Purple = drums
Previous
Tea Party Time-lapse | Zombie Scapes
Next